Welcome to Context Targeter, the behavioural planning tool for the real world.
1. HARNESSING CONSUMER CONTEXT/ACTIVITY CONGRUENCE
Behavioural economics, Recency Theory and industry research expound how reaching people 'in the moment' with related messaging boosts communications effectiveness. When considered alongside IPA TouchPoints revealing that media consumption accompanies over half of all time spent engaged in tasks and activities, it’s clear that putting this learning into practice via evolved media planning practices presents a tangible opportunity to enhance advertising outcomes.
To assist relevance planning of this nature, we've aggregated IPA TouchPoints statistics alongside related case studies to provide easy access to data and insight relaying how 'content media' can help brands connect with and influence consumers at appropriate moments.
Use this tool to find out which media are best placed to help you reach people across the day when engaged in tasks and activities relevant to your campaign - and seek inspiration from pertinent radio use cases.
2. ABOUT THE DATA
The audience data is based on IPA Touchpoints 2024 (released July 2024).
In response to industry studies highlighting the ways in which media channels impart a halo effect on how audiences perceive brands advertised within them, and the value of editorial context in enhancing engagement with advertising messages, this analysis focuses specifically on 'content media' i.e. that feature editorial content (either professionally or user-generated) which provides the main motivation behind audiences engaging with these media. In providing absorbing content that people access to meet a range of different (mainly emotional) needs, these media are best placed to deliver viable (effective) reach of audiences to those advertisers seeking to further extend their influence over broad audiences and generate new demand for their brands.
- For more detail about the data and for help using the tool please see FAQs .
- For information and data relating to reaching people in different emotional need-states, please see Audio Need-States Navigator.
3. THE SCIENCE BEHIND THE PROPOSITION (Behavioural Economics; Recency Theory)
a. The Power of NOW
Behavioural economics tells us that consumers engage less with future events than they do with events currently happening. This tendency to regard future events as different to their current equivalents can be harnessed in many ways. From an advertising perspective reaching people at the right time could prove crucial to driving them in-store or to your website. See here for more on The Power of NOW.
b. Inattentional Bias
Faced with a blizzard of sensory information in almost every moment, the brain would be overwhelmed if it wasn't for a process of selective attention that allows us to focus. This means that once we're tuned into certain aspects of the environment, we're left blind to events outside this selective attention - a phenomenon called "Inattentional blindness". Studies in the field propose that pure irrelevance is enough to render information invisible - even if we have plenty of resources available for processing that information. This state of "induced blindness" doesn’t just relate to attentional load but also salience and motivation. These factors in combination highlight why relevant messaging can play an important role in enhancing advertising cut-through and outcomes. See here for more on Inattentional Bias.
c. Recency Theory
The "recency theory" of advertising was devised by Erwin Ephron to help media planners optimise scheduling of campaigns. The theory is based on the notion that, to enhance its effects, advertising should talk to people at the right time i.e. when they're in the market to buy, close to the point of decision - and therefore more receptive/responsive to appropriate messaging. For example, FMCG advertising effectiveness will be enhanced when exposure occurs in the lead up to shopping trips to the supermarket, when people are deciding what to eat. See here for more on Recency Theory.
4. FREQUENTLY ASKED QUESTIONS
a. Media definitions and related audience data
The Audience section uses data from the IPA's TouchPoints diary, which asks questions about media consumption of TV, radio, newspapers, magazines and the Internet. From the full list of media types featured in the diary, we have focused our analysis on the following 'content media' (defined using the options available in the Touchpoints diary, as detailed):
- Linear TV (watching Linear TV on any device)
- On-demand AV (watching recorded/catch-up TV, or any form of on-demand video) *1
- Cinema (visiting the cinema)
- Linear Radio (listening to Linear Radio on any device)
- On-demand audio (listening to podcasts, on-demand radio, streamed online music) *2
- General browsing (general browsing)
- Social media (using social media)
- Published brands (reading any newspaper/magazine – print or online)
To ensure the most accurate representation of the share of media time spent with each of these media, we have re-worked the top-line media summaries listed in Telmar to remove duplication. The specific definitions of what is included within each media group are detailed above/below.
Share of media time is based on 'Meanz' so excludes any zero respondents. Media time is based on gross half-hour claimed consumption (across the whole week) & time slots (any day).
*1 - On-demand AV: Watching recorded TV, watching free on-demand video, watching catch-up TV, watching paid for on-demand video, watching paid for one-off viewing occasion, watching short online video clips (under 10 mins), watching longer online videos/programmes/films (over 10 mins), watching any online video (short or long form, not on TV set), watching live streaming of non-broadcast content
*2 - On-demand Audio: On demand/ listen again radio programmes, streamed online music, music video channels/ sites for background listening, radio podcasts, newspaper or magazine podcasts, other podcasts
b. How can I transfer the data into my presentation?
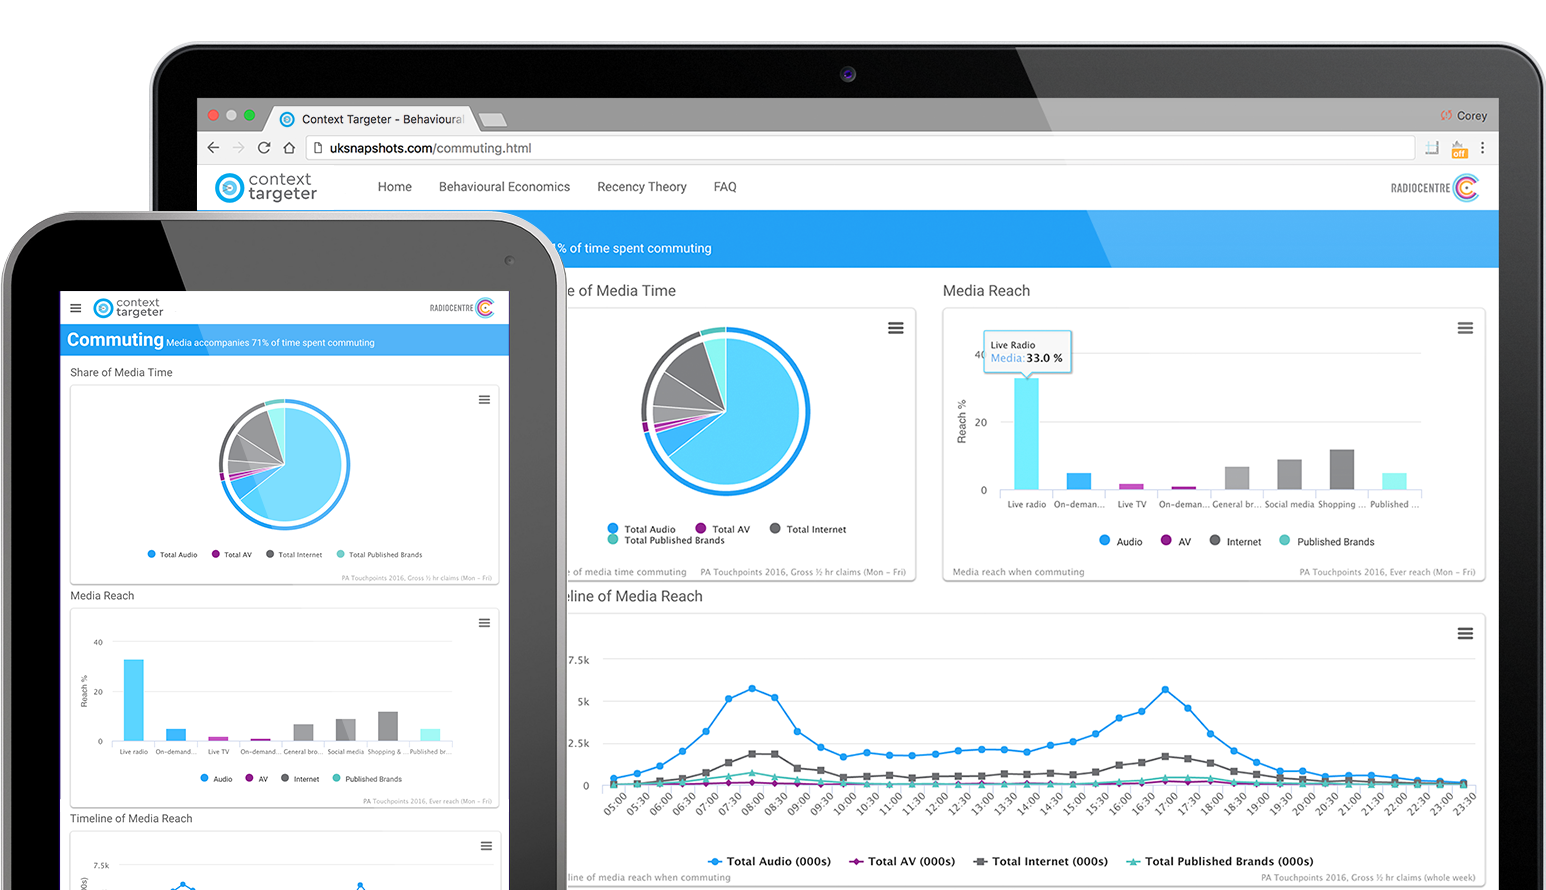
All charts and case studies are downloadable for your own use. Click the Menu button on each of the three audience data charts to access options to download in a range of formats.
c. What if I have further questions about the data or can't find what I'm looking for?
If you have any other questions that we haven't answered here, please contact us via jasmine.horsham@radiocentre.org or call on 020 7010 0600.